
Some projects land in your lap and immediately feel important. This was one of them.
The Crux Alliance is a consortium of specialized global think tanks working to advance high-impact policy measures across critical sectors of the clean energy transition. Their Grid Modernization & Flexible Electrification initiative, led by Agora Energiewende in collaboration with the Regulatory Assistance Project, ICCT, ITDP, GBPN, CLASP, and Agora Industry, is building a comprehensive policy toolkit to help modernize power grids around the world, enabling them to handle growing renewable generation and the rising demands of electrification. It’s serious, consequential work. And they needed a way to make it immediately understandable to a broad audience.
That’s where I came in.
The Concept: Two Futures, One City
The central challenge of this project was communicating a genuinely complex idea — what a modern, alliance-informed grid looks like versus a grid left without that coordinated approach — in a way that is visually immediate and intuitively explorable.
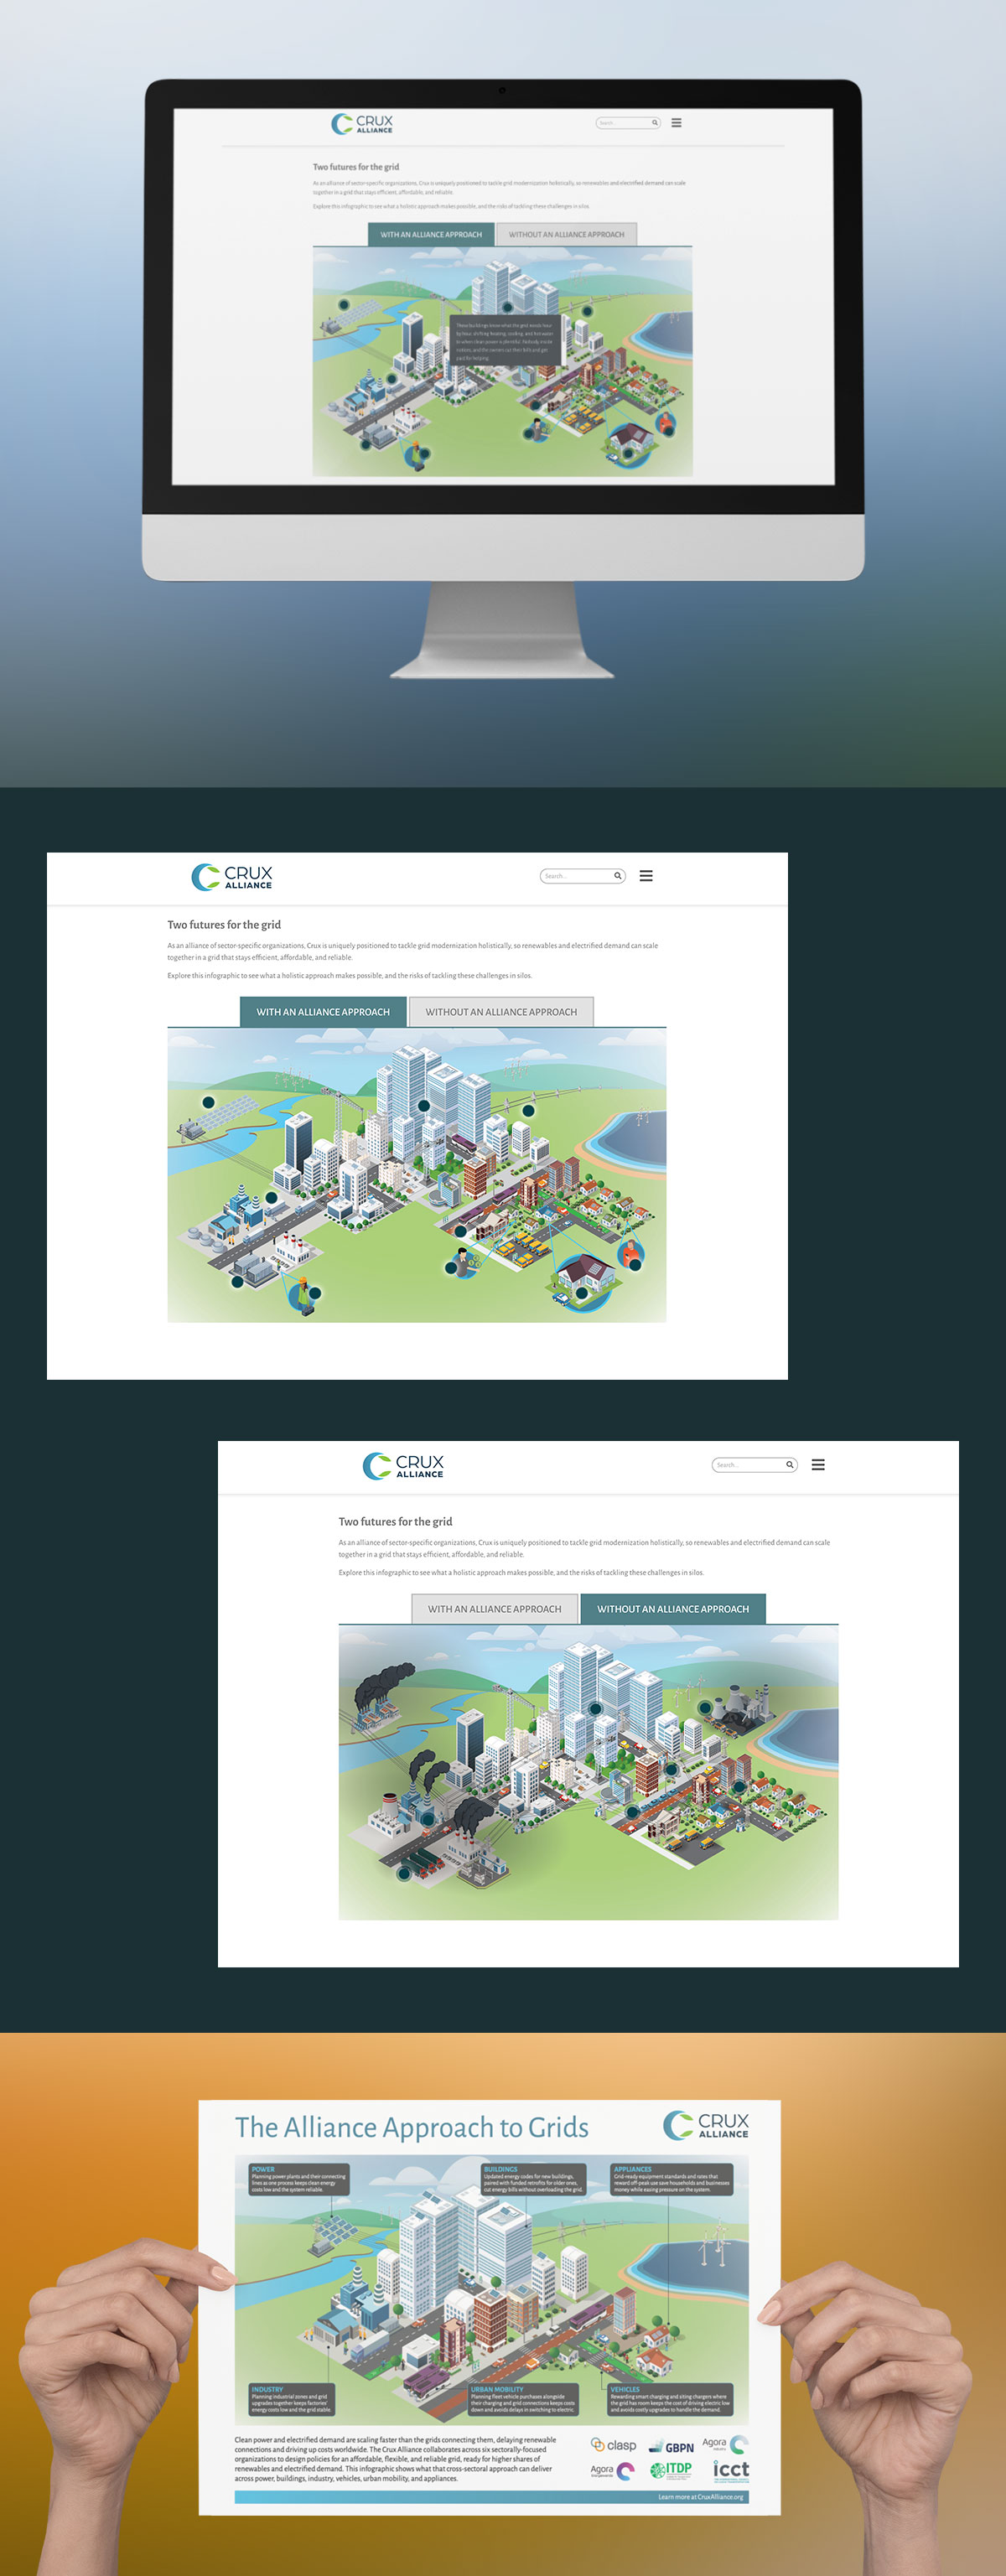
The solution is an isometric city illustration rendered at scale, divided into three distinct zones that mirror the real-world sectors the Crux Alliance works across: residential, commercial, and industrial. Every corner of the city is populated with the kind of detail that rewards close looking: buildings, infrastructure, energy systems, and the connective tissue of the grid running through all of it.
At the top of the illustration, two tabs give the viewer control: “With an Alliance Approach” and “Without an Alliance Approach.” Switching between them transforms the city. The same geography, the same layout, but dramatically different in how the grid functions, how clean the energy systems are, and how the community is served. It’s a before-and-after built into a single interactive frame, and it makes the Crux Alliance’s case more powerfully than any chart or bullet-point list ever could.
Interactive Tooltips
Layered across the city illustration are interactive highlight points, clickable markers that open tooltips explaining specific features of the grid in that part of the city. A solar array on a rooftop, a charging station on a street corner, an industrial facility tied into the grid. Each one becomes a moment of explanation, connecting the visual to the policy. The viewer doesn’t just see a better-functioning city; they understand why it functions better and what specific grid modernization decisions made the difference.
This kind of interactivity transforms an infographic from something you look at into something you explore. It respects the intelligence of the audience while making complex information genuinely accessible.
From Screen to Print: New York Climate Week
The illustration wasn’t only designed for the web. A print version of the infographic was produced for use as a physical handout, and it made its debut at New York Climate Week, one of the premier global gatherings for climate action and clean energy policy.
Seeing a piece move from an interactive web experience to a printed handout in the hands of policymakers, advocates, and decision-makers at an event like that is a meaningful moment. The design had to work in both contexts: as a rich, explorable digital experience and as a clear, compelling static document. I’m proud of how it holds up in both forms.
Illustration at the Intersection of Policy and Communication
Projects like this are a reminder of what illustration can do that data tables and policy briefs cannot. When the stakes are high and the audience is broad, a well-crafted visual can close the gap between expert knowledge and public understanding in a way that nothing else quite matches. The Crux Alliance is doing important work on the global energy transition, and it was an honor to help give that work a visual language worthy of the mission.
See the illustration in action at: https://cruxalliance.org/our-impact/cross-sectoral-initiatives/#Grids


